How to create an iOS widget to track your Bubble app's stats
Show data from your Bubble app on your iPhone or Mac using widgets, great for tracking things like sales, churn and usage on your Bubble application from anywhere.
Hi there,
James here from the NoCodeSaaS newsletter - the newsletter that takes you along for the ride on building a profitable SaaS business without code on Bubble.
This week I wanted to share a useful hack I came across when tracking important statistics in my Bubble application - having them show on my iPhone and Mac lock screens as a widget.
Above is an example that shows live data from my app, tracking the number of survey responses, emails sent and customer signups for today.
You could also show things like your app’s revenue, churn or the latest user to sign up.
This is actually pretty simple to set up with Bubble, so you can show pretty much any information from your app on your device. It takes about 30 minutes to get everything set up and running.
The great news is with the new MacOS update Sonoma with continuity mode, these widgets can also live on your app’s desktop, giving you a quick and easy way to check on your app’s activity, here’s an example of how the widget looks on a desktop.
So, with that said let’s dive into getting this set up.
Step 1. Create an API Workflow in Bubble
To get started, we need to pull together the data we need from Bubble to show in our widget.
In my example I’m going to create an API workflow which returns 3 metrics.
Count of survey responses today
Count of emails sent by the app today
Count of users to sign up today
To do this, we need to hop into our app’s API / backend workflow mode and start on a new workflow.
So let’s give the workflow a name, and check the box to expose it as an API workflow.
Depending on your security preferences, you may or may not want to check the ‘This workflow can be run without authentication’ checkbox.
In general I recommend not checking this box, we want to keep your data secure so we should use an API key from the Bubble Settings page when calling this workflow, we’ll cover how to set this up later.
We also want to trigger this workflow with GET so make sure you have selected that option.
Once we’ve created our workflow, we need to add a single step.
The step should be the ‘Return data from API’ action.
For Content-Type select ‘Structured JSON’. Then add each of the metrics you’d like to show in your widget.
Use searches, or whatever operator you need to return the data. Just make sure you select the right data type, for example in this tutorial we’re just looking at numbers but you could also add text or any other type of data you want.
Once we’ve got our API endpoint all set up and ready to go, it’s time to set up the widget configuration on our iOS device.
Install & Configure Widgy for iOS
The first thing we need to do is install the Widgy app for iOS, this is the app where we are going to create and edit our widget.
Once you’ve got the app installed, you can either start building your widget from scratch, or start with the template I’ve made.
This basically gives you a starting point of a widget with 4 dials that you can add data to.
You can install my Widgy template here, you’ll need the app installed for this to work!
In the demo file, I’ve added a dummy JSON endpoint to give you an idea of how the setup works but you’ll need to update these with your own Bubble endpoint.
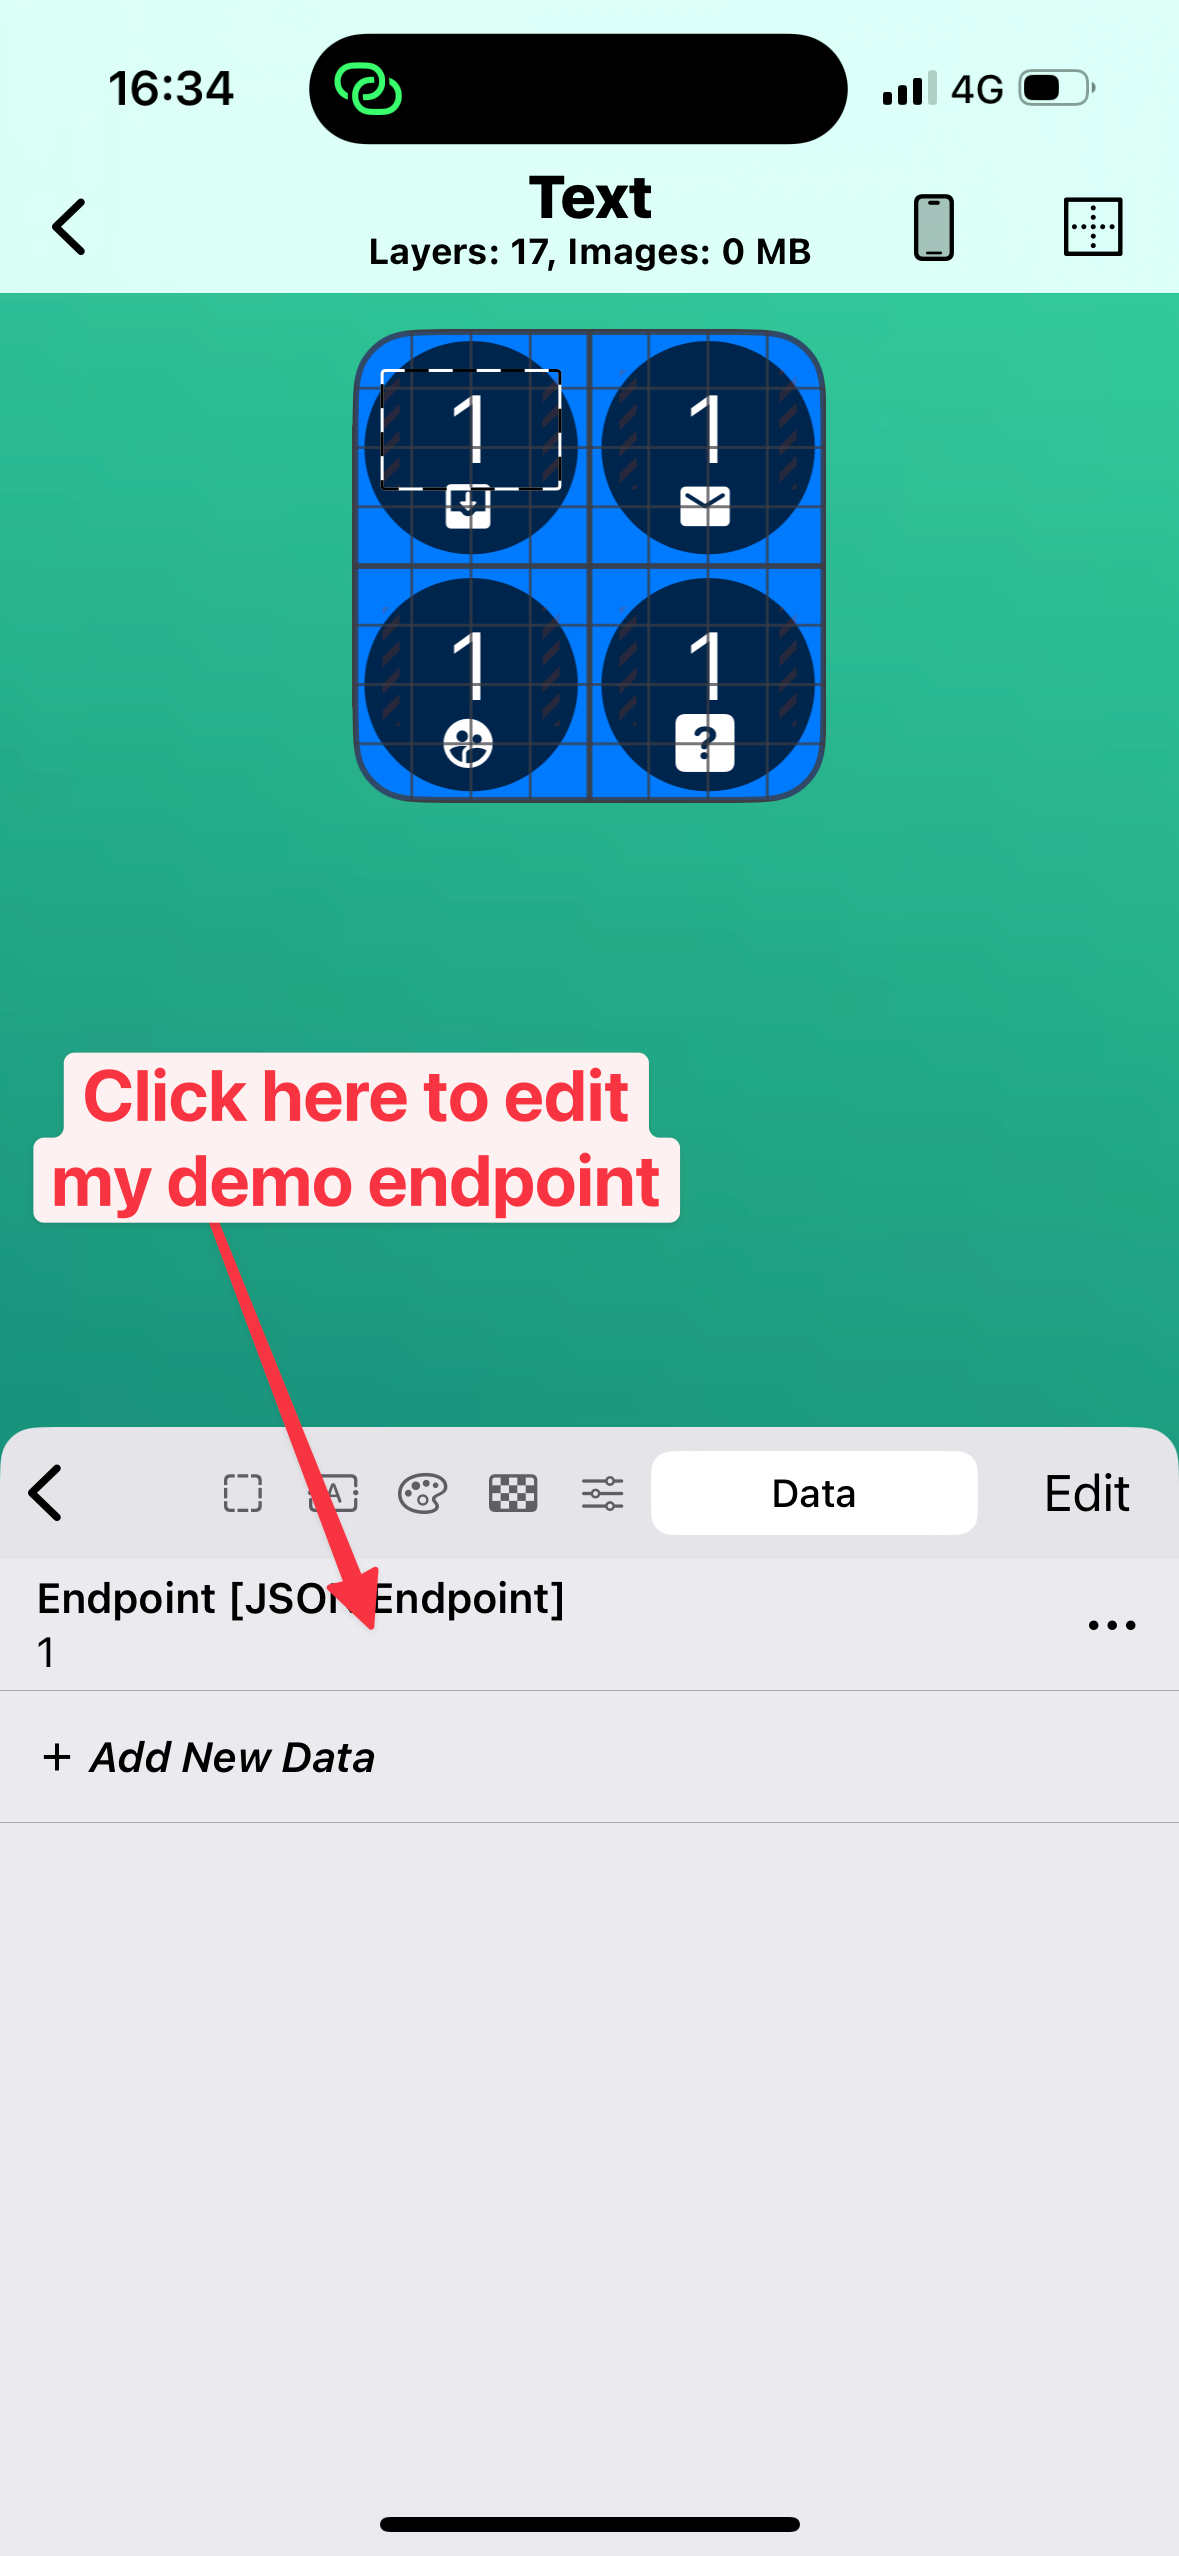
To do this, open up the widget template and click one of the numbers on the dials.
Then you’ll see the above menu, and can click the cube icon to bring up the data menu.
Click on the example endpoint and it will open up the screen to add the URL to the Bubble API workflow we set up earlier.
In the top line, we need to put the public URL to our Bubble workflow.
Note: If you did not select the checkbox in Bubble to make the workflow public, you’ll need to create and add an API Key from Bubble in the ‘Bearer Token’ box above.
You can get that from the Settings page in Bubble, under the API tab. Simply copy the key from here and paste it in Widgy’s ‘Bearer Token’ box.
Once you’ve got this all set up, hit the ‘RUN’ button and Widgy will make the request to Bubble.
Then you’ll be shown the screen above, which will list out all of the fields you set up in Bubble, simply select the one you’d like to show in the metric.
It will then show up in the Widgy UI.
You might also want to customize the icons underneath each dial, you can do this by simply clicking on the icon in the editor, and selecting a new one.
Of course - you can create your own widget designs to pretty show anything you want in any style. Widgy is very powerful but also quite fiddly with it’s UI, so you might find it easiest to start out by using my template.
I hope you find this useful - it’s a really handy way to visualize any kind of information from your Bubble app, by default updates the data every 15 minutes.
If you have any feedback about this issue, or you have any topics you’d like me to cover in future please drop me a reply.
That’s it for this week, happy building!


