📈 Adding Analytics & Calculated Metrics to your NoCode SaaS App - Issue #10
Hey there!
Welcome to the 10th issue of NoCodeSaas.
This week I’m looking at how best to add analytics capabilities to your no code application.
If you’re building a SaaS, it’s quite likely you’re going to need some kind of analytics in your product to show users key information about their usage and performance.
I’m going to be focussing on two amazing plugins that help you build in analytics in this issue…
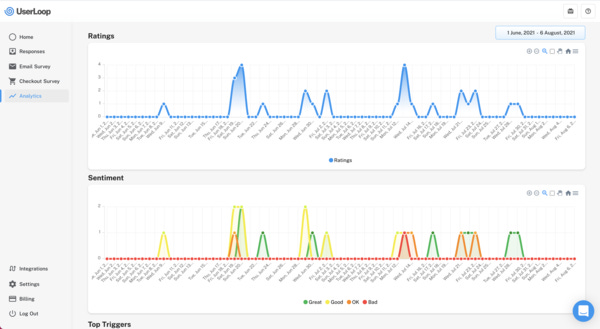
For my application UserLoop, here are a couple of examples of the kinds of analytics I provide to users in the product.
How many emails a user has sent
How many emails have been opened / clicked
How many survey responses you’ve had from customers
Customer sentiment - how happy are your customers
Trigger events - what events are resulting in users completing a survey
CSAT / NPS Scores - calculated scores giving an indication of customer satisfaction
Ratings & Sentiment Analytics in UserLoop
There’s lots of ways you might choose these analytics.
Today I’m going to cover showing them as charts and as metrics - and the things you need to bear in mind to make providing these kinds of statistics performant in your application.
It’s worth thinking through your data structure carefully before starting to add analytics to your app.
You want the front end to have a fairly straightforward job of displaying data from your database with a limited amount of searches and queries involved.
The more complex the query, and the larger the number of records the slower your front end is going to work.
You can do a few things to deliver a good experience to your users and minimize slowdowns.
Let’s take a look…
Default Timeframes
You absolutely do not want to load in all your analytics data from the moment a user signed up. It’s going to be a huge amount of data, and get bigger all the time!
This is likely to result in huge slow queries.
One technique you can use to limit the amount of data you’re loading is to use a date range picker.
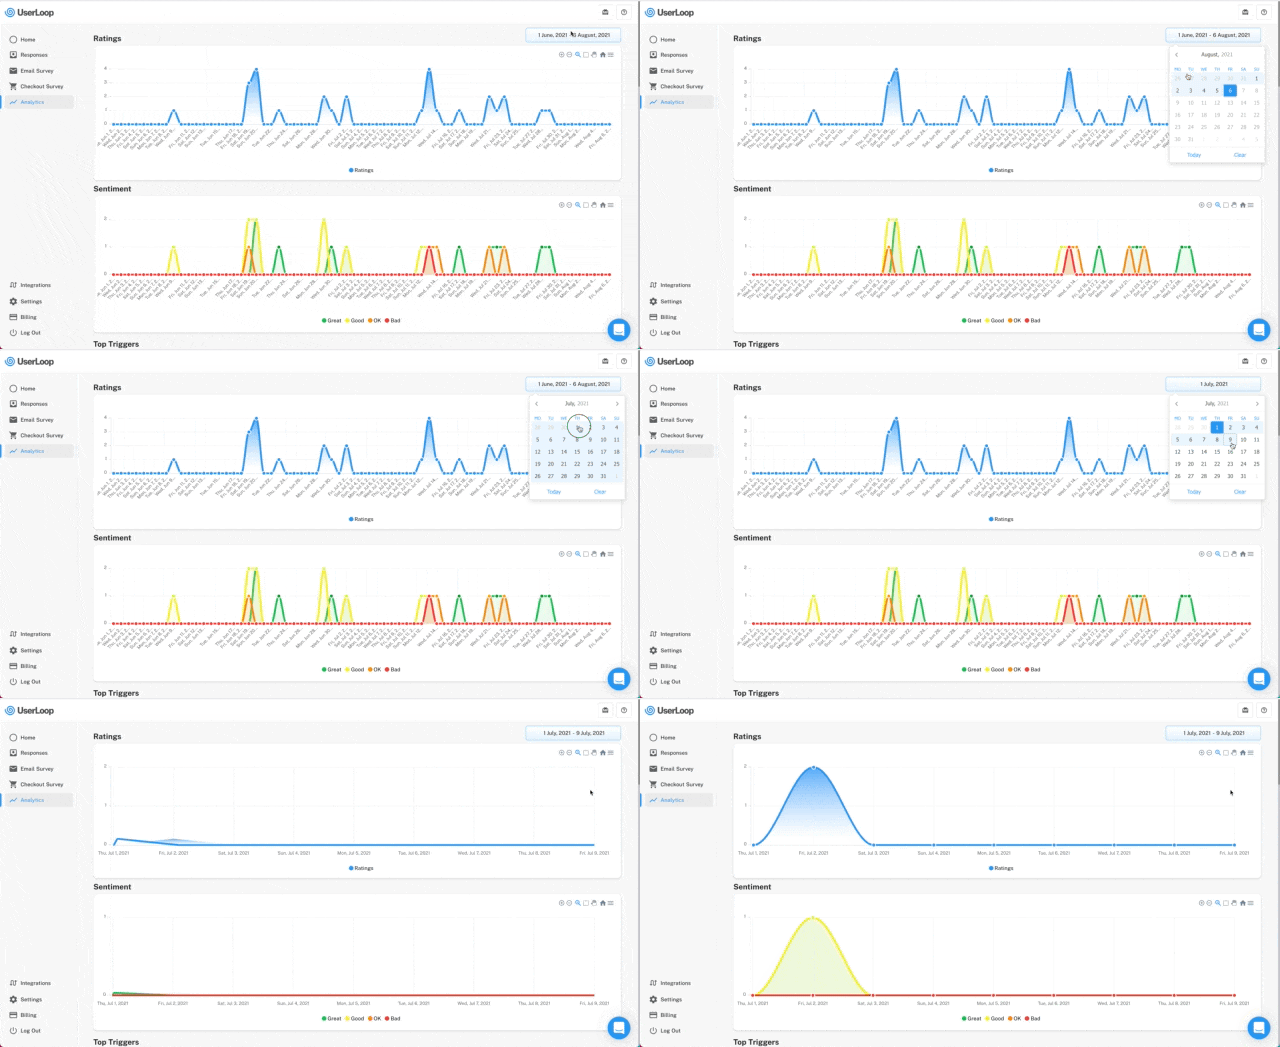
I’m showing an example here which is using the ApexCharts.js plugin and the Air Date / Time Picker with the date range option enabled.
Allow users to customize the timeframe of their analytics.
As you can see in the example above, I’ve added a date picker that lets the user select a time period for the data they want to view.
By default, I’ve set this to something quite short - 7 days.
This means when the user first loads the analytics page I’m only loading in data for the last 7 days and not everything at once - which is likely to make the page slow down.
The user can then make adjustments to the time range. As soon as they set a new date range the chart element will update with the new results.
To populate the chart, we need to connect the start & end dates from the date picker element to our search query.
As you can see below, I’m running a search for all responses for the selected company.
I want the Created Date to be > than the date pickers start date
and
I want the Created Date to be < than the date picker’s end date
This means that my search is only going to return data for the dates in between the range the user has selected in the date picker.
User Created Date <> operators to limit your results.
Calculate Metrics Server-side
It’s likely your application might have some metrics you want to calculate for every customer for them to see in the front end.
Depending on the kind of metric you want to show, it can make sense to calculate the value on the server side rather than doing it in the browser.
For example, if you need to search across hundreds or even thousands of records to calculate the metric - it’s going to radically slow your front end down.
In my application, every company has 2 scores which are calculated based on all of the customer responses they’ve had.
CSAT (Customer Satisfaction) and NPS (Net Promoter) scores require you to run a simple equation by adding all of your customer responses together.
Calculating metrics like ths in the front end can be slow, do it server side.
For a while I was doing this on the page in Bubble and it became very slow.
The more data you are having to search through the slower your UI is going to become - until the point it becomes unusable.
I decided to move the calculation of these metrics to the server side, where they are stored as a static value in the database.
This means the front end only has to read a simple number from the db, rather than making a heavy and slow calculation.
Here’s how I set it up.
First - add a new field in your database where you are going to store your calculated metric for the given user.
In my case I created new number fields on the company entity called CSAT and NPS. I’ll always store the calculated score in that field for each user.
Second - set up a new database trigger that will fire whenever a database record is updated or changed. In my case, this is triggered whenever a new response is received.
This database trigger fires whenever a response is created or changed.
This in turn triggers a workflow which calculates the customer's NPS score and saves it to the datbase.
All this means that every time a new response is created, these backend workflows take care of updating the required metric server side.
It’s then stored in your database as a static figure you can use for whatever you want. Put it in your UI, in an email or wherever you want. It will always be up to date and calculated for you to use.
Recurring Event Analytics
If your app has a lot of data, and multiple metrics you want to be able to track every day it may make sense for you to use a recurring event to calculate it.
This means there is a job that runs on your server at the same time every day which calculates metrics and stores them to your database.
For example, I use this in my application to make a daily count of all the feedback a user has received.
How many are positive, how many are negative, what was the total revenue for the day etc.
I then store all this data in a table called ‘analytics’ linked to the user’s company.
This means I’m able to show it on graphs and it will load lightning fast, as all the processing is already done every night at midnight and stored as simple numbers in my database.
The alternative would be to run extremely heavy and slow searches from my front end to populate charts which would result in a poor user experience.
There’s also the added benefit of having all these metrics easily accessible if you want to include them in a weekly summary email to your users for example.
Recurring Event called 'DailyAnalytics' which saves a daily set of metrics for every user
Just getting started with NoCode?
Kieran has just launched a new course aimed at people starting out with NoCode.
It contains a huge amount of curated and hand-picked resources designed to get you up and running with your no-code app quicker than ever.
I’m a huge fan of everything Kieran does so it’s worth checking out!
Thanks for reading!
I’m thrilled to have published the 10th edition of NoCodeSaaS.
It’s been a fantastic journey so far. I’ve spoken with so many people who are building mind blowingly good products with no-code.
Every week I love hearing from you all on what you’re building - and helping where I can.
The community around ‘no code’ has to be one of the most positive and supportive I’ve ever encountered - I’m really honoured to have play a tiny part in it and have you as a subscriber.
I hope you enjoyed the issue, until the next time - happy building!
James


